particle backscattering
Spectral variations of light scattering by marine particles in coastal waters, from visible to near infrared
The open-ocean missing backscattering is in the structural complexity of particles
I’m gonna to add more about this.
Spectral variations of light scattering by marine particles in coastal waters, from visible to near infrared
Theoretical background of particle backscattering
Light scattering by a single particle depends on its geometrical cross-section (thus shape and size) and on its refractive index relative to that of the surrounding medium (seawater). The refractive index of particles relative to water can be written as: m = n − in′ where n and n′ are respectively the real and imaginary parts of the refractive index.
Typical n values vary from 1.03 and a theoretical upper limit of 1.158 for organic particles (Morel and Ahn 1990; Aas 1996), depending on hydration, and from 1.07 to 1.22 for various minerals (Lide 2001).Woz´niak and Stramski (2004) observed general tendency of increasing n with increasing density of minerals. Typical values and spectral variations for n9 have been documented by Patterson et al. (1977), Egan and Higelman (1979), and Stramski et al. (2007).
In estuaries and coastal waters directly influenced by river inputs, single-grain mineral particles may either appear as individual particles in water or as aggregates containing water and organic matter.
Large estuarine aggregates reaching sizes up to 1000 µm have been observed using video cameras (Kranck 1984). When considering a population of particles, their concentration (number of particles per unit volume of water sample containing these particles) and size are taken into account through the particle size distribution (PSD) (Jonasz and Fournier 2007). Different functions can be used to fit actual PSDs, such as exponential, log-normal, phi-normal, or hyperbolic distributions. In natural waters, the size distribution of suspended particles is often assumed to follow a simple power-law function, also called Junge size distribution(Bader 1970): N(D) = KD−j where N is the number of particles of diameter D per cubic meter and per micrometer, K sets the concentration of particles, and j, often called Junge exponent, is the slope of the distribution.
This exponent varies around a mean value of 4 and typically from 2.5 to 5 (Jonasz and Fournier 2007). For a fixed number of particles, the proportion of small particles increases when the exponent j increases. The use of Junge distributions for marine particles has been criticized (Risovic 2002; Stavn and Keen 2004; Chami et al. 2006).
Although some field measurements carried out in coastal waters suggest PSDs close to a power-law distribution (Boss et al. 2001a), others reveal significant features at any size range on top of a power-law PSD (Bale and Morris 1987; Eisma et al. 1991; Bernard et al. 2001).
Note also that current particle-sizing techniques for discrete and in situ sampling, such as the resistive particle-counting technique (e.g., Coulter counter) or laser diffraction (e.g., the LISST series, Sequoia Scientific), are typically limited to the range 1–200 mm (Agrawal and Pottsmith 2000).
Apart for a few measurements reported by Stramski and Woz´niak (2005) (see their figs. 1, 2), there is currently a lack of information concerning the finest fraction of particles (,1 mm) which, especially when it is mineral, contributes significantly to light scattering (see fig. 4a in Babin et al. 2003a).
Mie theory can be used to compute the optical properties of particles that are assumed homogeneous and spherical. Mie computations notably provide the efficiency factors for scattering and absorption (Qb and Qa). The corresponding coefficients are then obtained by integration over the size distribution: $$ b_{p}(\lambda)=(\frac{\pi}{4})\int_{D_{min}}^{D_{max}}N(D)Q_b(\lambda,D,m)D^2dD \\ a_{p}(\lambda)=(\frac{\pi}{4})\int_{D_{min}}^{D_{max}}N(D)Q_a(\lambda,D,m)D^2dD $$ where λ is the wavelength of light, whereas the minimum and maximum diameters, Dmin and Dmax, define the size interval.
Theoretically, the spectral variations of bp, in the case of nonabsorbing and homogeneous particles distributed in size according to Eq.2 with Dmin and $D_{max} $ respectively equal to 0 and infinity, can be written: bp(λ) = Aλ−γ The exponent of this power law, γ, also called scattering spectral slope, is then simply related to the slope of the PSD, j, through (Morel 1973): γ = j − 3 To verify Eq. 5 with the Mie theory, the actual limits Dmin and Dmax chosen for calculations in Eq. 3 must be small and large enough, respectively, to account for most of particle scattering at all wavelengths (Morel 1973; Boss et al. 2001b).
This condition also applies to ap(λ) calculations for the sake of obtaining results independent of Dmin and Dmax.
Equations 4 and 5 are no longer valid in the case of absorbing particles (n′ > 0). To understand the influence of particulate absorption on bp(λ), the effect of n′ variations both on the real and imaginary parts of m must be considered.
The former phenomenon can be explained and modeled according to the Ketteler–Helmhotz theory of anomalous dispersion (Bricaud and Morel 1986). It is significant in the vicinity of absorption bands such as the major ones observed on phytoplankton cells in the blue and red parts of the spectrum. In the case of detrital and mineral marine particles for which the absorption coefficient generally varies smoothly with wavelength, variations in n resulting from anomalous dispersion are negligible.
The effect of absorption on bp(λ) through the contribution of n′ to m, which is certainly much more important than the effect of anomalous dispersion even for phytoplankton, is accounted for by the Mie theory and expressed in the computed efficiency factors (Morel and Bricaud 1986).
Typical bp(λ) spectra for phytoplankton cultures and phytoplankton-rich natural waters exhibit troughs at wavelengths corresponding to major peaks in the particle absorption spectrum (Bricaud et al. 1988; Babin et al. 2003a; Snyder et al. 2008). In the case of nonalgal particles found in coastal waters, the bp(λ) spectrum often depicts a decreasing trend at short wavelengths of the blue range (e.g., Fig. 1 and Babin et al. 2003a).

The particulate scattering coefficient of nonabsorbing particles is denoted bpna
Result 1
It is in this figure.
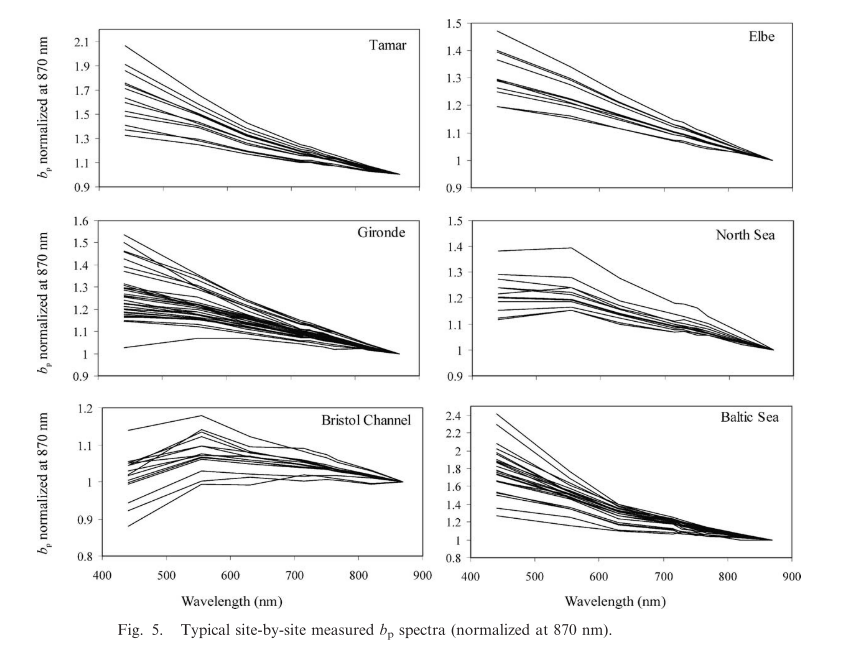

On the basis of these first results, we conclude that particulate absorption effects on the scattering are always significant in the visible, even when wavelengths associated with high particulate absorption are avoided. A unique power-law function (e.g., Eq. 9) cannot be used to model the bp spectral variations from the near IR toward the visible (Eck et al. 1999). Further investigations are needed concerning these particulate absorption effects to propose an improved model of the bp(λ) spectrum in the visible.
Result 2
I want to mainly focus on this part.
In this section, the particulate scattering coefficient of nonabsorbing particles is denoted bpna. The bpna values are obtained by assuming that measured near-IR$ b_{p}$ values effectively represent bpna at these wavelengths and Eq. 9 can be used to extrapolate to visible wavelengths.
The particulate scattering coefficient of absorbing particles is
denoted by bp, and the difference from Eq. 9 due to absorption effects
is written: Δbp(λ) = bpna(λ) − bp(λ) = f(ap)
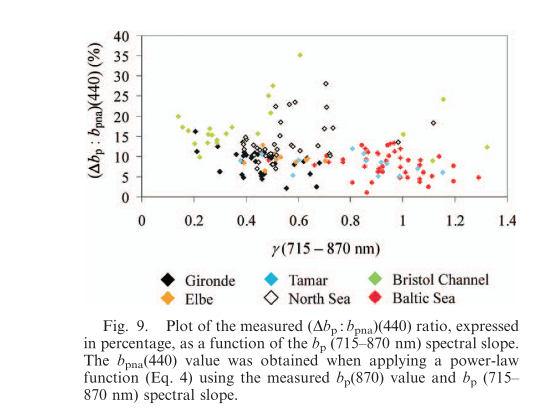
The results clearly show a significant departure, in a range varying from 1% to 35%, that slightly increases with decreasing values of the bp near-IR spectral slope (Fig. 9). The

The relationship between (Δbp : ap)and γ is not linear and can be closely reproduced by using the following equation: Δbp/ap = 1 − tanh(0.5×γ2) where the 1 and 0.5 constants correspond to a mean value of the real refractive index (n 5 1.10). These constant values are slightly different for n values of 1.05 or 1.18.
写得很好 就是我不想看了QAQ
最终 出来这个式子

The open-ocean missing backscattering is in the structural complexity of particles
Retrieval of Particulate Backscattering Using Field and Satellite Radiometry: Assessment of the QAA Algorithm
又是这几个老熟人发的文章。
用的是V19+CNR+BOU的数据。V19就是那个公开数据集,CNR是他们自己采集的,曾经发表在Pitarch2016上,看来这个一作也是搞bbp的老熟人了啊,BOU在这http://www.obs-vlfr.fr/Boussole/html/home/home.php,看来想获取还挺麻烦的。一共2881个Rrs+bbp。


Remote Sensing这个期刊真的是越来越垃圾了,这个图都不让作者改一下的
需要注意的是BOU数据集看起来并不是近岸的水,但是bbp也出现那个比例小于1的情况了。
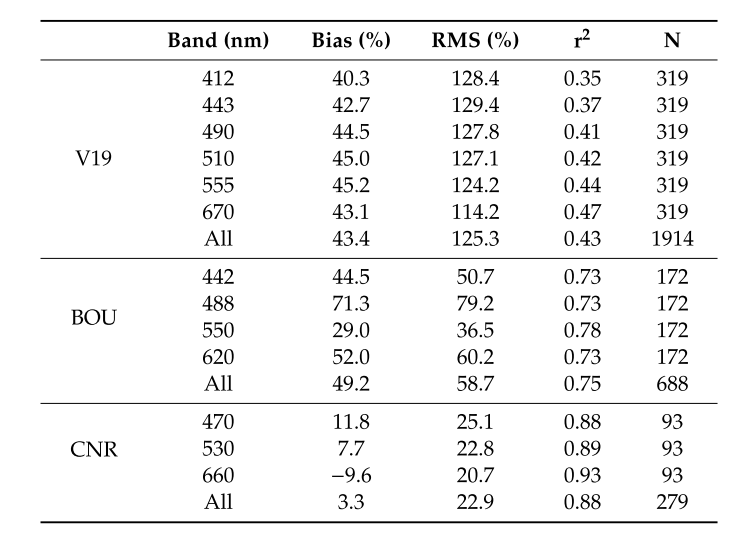
这是分别的统计情况,这个是在去除Raman之前的。
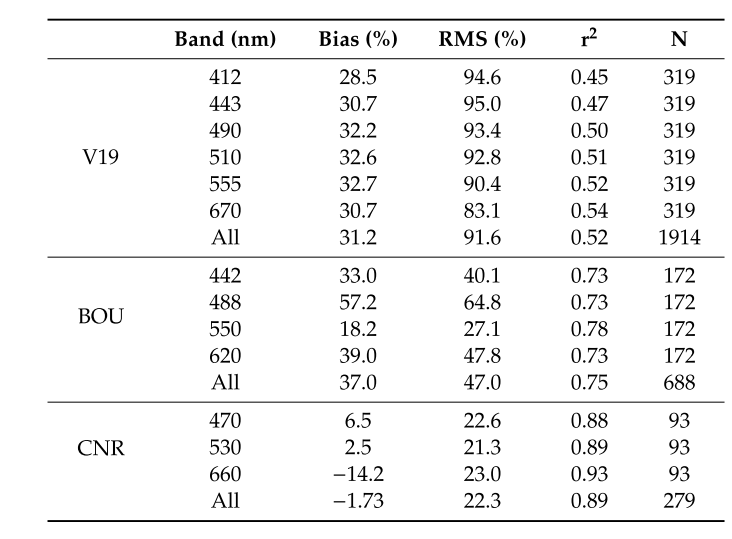
这个是在去除Raman之后的
这个作者也尝试了改进那个公式。

最终结果是
The in situ radiometry-derived spectral backscattering slope (η) has low predictive value as compared to η derived from bbp matchups. In this context, the impact of using the best fitted curve instead of the widely used expression [22] is negligible, thus validating the application of the latter without its retuning.
bbp shape function summary
类QAA
这个是用来总结见过的,当然了,不包括LS2那篇文章,那个我到现在没看懂。
QAAv6

Joshi and D’sa 2018

Doxaran 2009

Wang 2017

Xue,2019

Chu 2020

其实我感觉我想要的答案在QAA类的文章里都找不到。
那我看看其他的都是怎么搞出来的
LS1 and LS2
回头重新看了眼Werdell2018那个综述。里面提到关于不假设bbp shape或者说不假设为power law的只有这个LS1和LS2

这是唯一一种Bulck inversion that do not assign the shape of bbp.
先发个邮件要个代码吧。
bbp problem literature review
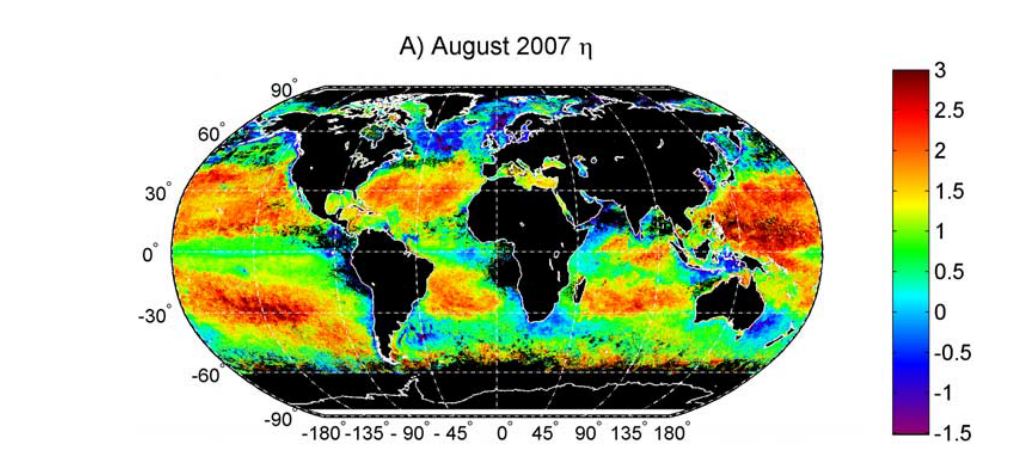
$$ b_{bp}(\lambda)=b_{bp}(\lambda_0)(\frac{\lambda_0}{\lambda})^{\eta} $$
η Typically varies between 0 and 3, largely driven by varing proportion of large and small particles(Werdell et al 2018)
Reynolds et al 2016: Based on bbp(λ) values from 394 to 852 nm collected in the Arctic, Reynolds et al. (2016) reported the range of Sbp from 0.13 to 3.01 with the majority of data (80%) between 0.5 and 1.5, a median value of 1, and a mean value of 1.5. In

Note that the Slope is contradict
William et al 2007:
They fit by $$ f(\lambda)=f_{550}(\frac{\lambda}{550})^{\gamma} $$ The γ also versus

only slightly higher than 0 (smaller than 0)
Loisel et al 2006

Pitarch et al 2019

some slightly smaller than 0
Shi&Wang 2017:
VIIRS observation


7 is Meghna River Estuary

2 is Hangzhou Bay 4 is Amazon River Estuary
Finally found some reason
Power slope g is related to the particle size distributions (PSDs), i.e., f ? g 2 3 (Babin et al., 2003; Kostadinov et al., 2009; Morel, 1973), where f is the power law slope of the Junge-type (Junge, 1963) size distributions (Balder, 1970; Sheldon et al., 1972; Twardowski et al., 2001). In fact, particle backscattering properties are determined by particle size distribution, particle shapes, and composition. However, particle size distribu- tion is the dominant factor in determining the particle scattering features such as the backscattering power law slope and the backscattering ratio (Kostadinov et al., 2009; Ulloa et al., 1994). For most of the satellite- derived global bbp(k) and the available in situ observations, particle backscattering power law slope g is typi- cally positive or close to 0 (Loisel et al., 2006; Reynolds et al., 2016; Stramski et al., 2007; Wozniak & Stramski, 2004). This shows that bbp(k) decreases with the wavelength for VIIRS-derived bbp(410) to bbp(862). However, g may also be negative for large size particles (Kostadinov et al., 2009). Correspondingly, bbp(k) in the NIR wavelengths thus are larger than those in the visible bands. In China’s east coastal region, in situ bbp(k) can indeed increase with the wavelength at some highly turbid locations (Zhang et al., 2010a).
In this study, VIIRS-derived bbp(k) images in the five turbid regions (Figures 3–7) and bbp(k) at the eight sta- tions (Figure 8) show that the particle size distribution in the water column is highly dynamic depending on the regions and the seasons. At Stations 1 and 2 in China’s east coastal region, bbp(k) increases with the increase of the wavelength during the winter season, while bbp(k) decreases with the wavelength during the summer season. This shows that the g is negative in the winter and positive in the summer, and might further suggest that the particle size is bigger in the winter (f<23) than that in the summer (f>23). The seasonal variation of particle size distribution in the water column may be attributed to the seasonal vari- ability of the turbulence and water mixing process driven by the seasonal monsoon in China’s east coastal region (Shi & Wang, 2010a, 2012a).
At Station 4 in the Amazon River Estuary (Figure 8d) and Station 7 in the Meghna River Estuary (Figure 8g), bbp(k) increases with increase of the wavelength for all seasons, while bbp(k) decreases with the increase of the wavelength for all seasons at Station 6 in the La Plata River Estuary (Figure 8f) and Station 8 in Atchafa- laya River Estuary (Figure 8h). This further suggests that the particle sizes at Stations 4 and 7 are generally larger than those at Stations 6 and 8. At Station 3 in Lake Taihu (Figure 8c) and Station 5 in the Amazon Riv- er’s north branch (Figure 8e), bbp(k) is generally flat for all seasons, implying that particle size in the water column is more or less the same even though bbp(k) can vary seasonally at these two stations. It is also noted that bbp(k) power law slope is still positive even though nLw(k) at the NIR bands in the La Plata River Estuary is similar to that in China’s east coastal region (Figure 2). This indicates that bbp(k) power law slope is not only seasonal-dependent, but also regional-dependent. If nLw(k) at the NIR bands is approximated as the surrogate of the TSM concentration, the particle size in the La Plata River Estuary is smaller than that in China’s east coastal region even though the TSM concentration at these two regions is similar
There are two main refference here
Kostadinov et al., 2009:
This is also satellite observation
This figure is a modeled result


Zhang et al 2010

Measured Spectrum
I think I need a new post to learn the optics of backscattering