Basis for subplot2grid, ticker, enumerate, seaborn, plt/ax/fig
一些在读别人代码的时候发现自己还没有掌握的东西。
matplotlib.ticker
定位
Tick locating
The Locator class is the base class for all tick locators. The
locators handle autoscaling of the view limits based on the data limits,
and the choosing of tick locations. A useful semi-automatic tick locator
is MultipleLocator.
It is initialized with a base, e.g., 10, and it picks axis limits and
ticks that are multiples of that base.
The Locator subclasses defined here are
-
MaxNLocatorwith simple defaults. This is the default tick locator for most plotting. -
Finds up to a max number of intervals with ticks at nice locations.
-
Space ticks evenly from min to max.
-
Space ticks logarithmically from min to max.
-
Ticks and range are a multiple of base; either integer or float.
-
Tick locations are fixed.
-
Locator for index plots (e.g., where
x = range(len(y))). -
No ticks.
-
Locator for use with with the symlog norm; works like
LogLocatorfor the part outside of the threshold and adds 0 if inside the limits. -
Locator for logit scaling.
-
Choose a
MultipleLocatorand dynamically reassign it for intelligent ticking during navigation. -
Locator for minor ticks when the axis is linear and the major ticks are uniformly spaced. Subdivides the major tick interval into a specified number of minor intervals, defaulting to 4 or 5 depending on the major interval.
There are a number of locators specialized for date locations - see
the dates module.
You can define your own locator by deriving from Locator. You must
override the __call__ method, which returns a sequence of
locations, and you will probably want to override the autoscale method
to set the view limits from the data limits.
If you want to override the default locator, use one of the above or a custom locator and pass it to the x or y axis instance. The relevant methods are:
1 | ax.xaxis.set_major_locator(xmajor_locator) |
The default minor locator is NullLocator,
i.e., no minor ticks on by default.
格式
Tick formatting
Tick formatting is controlled by classes derived from Formatter. The formatter operates on a single tick value and returns a string to the axis.
-
No labels on the ticks.
-
Set the strings from a list of labels.
-
Set the strings manually for the labels.
-
User defined function sets the labels.
-
Use string
formatmethod. -
Use an old-style sprintf format string.
-
Default formatter for scalars: autopick the format string.
-
Formatter for log axes.
-
Format values for log axis using
exponent = log_base(value). -
Format values for log axis using
exponent = log_base(value)using Math text. -
Format values for log axis using scientific notation.
-
Probability formatter.
-
Format labels in engineering notation
-
Format labels as a percentage
You can derive your own formatter from the Formatter base class by
simply overriding the __call__ method. The formatter class
has access to the axis view and data limits.
To control the major and minor tick label formats, use one of the following methods:
1 | ax.xaxis.set_major_formatter(xmajor_formatter) |
See Major
and minor ticks for an example of setting major and minor ticks. See
the matplotlib.dates
module for more information and examples of using date locators and
formatters.
参考
https://matplotlib.org/3.1.1/api/ticker_api.html
https://matplotlib.org/3.1.1/api/ticker_api.html
enumerate
描述
enumerate() 函数用于将一个可遍历的数据对象(如列表、元组或字符串)组合为一个索引序列,同时列出数据和数据下标,一般用在 for 循环当中。
Python 2.3. 以上版本可用,2.6 添加 start 参数。
语法
以下是 enumerate() 方法的语法:
1 | enumerate(sequence, [start=0]) |
参数
- sequence – 一个序列、迭代器或其他支持迭代对象。
- start – 下标起始位置。
返回值
返回 enumerate(枚举) 对象。
实例
以下展示了使用 enumerate() 方法的实例:
1 | >>>seasons = ['Spring', 'Summer', 'Fall', 'Winter'] |
普通的 for 循环
1 | >>>i = 0 |
for 循环使用 enumerate
1 | >>>seq = ['one', 'two', 'three'] |
参考
https://www.runoob.com/python/python-func-enumerate.html
subplot2grid
这个可以自定义子图的位置,并且可以跨越原来大小。
原文https://wizardforcel.gitbooks.io/matplotlib-user-guide/content/3.3.html
1 | GridSpec |
指定子图将放置的网格的几何位置。 需要设置网格的行数和列数。 子图布局参数(例如,左,右等)可以选择性调整。
1 | SubplotSpec |
指定在给定GridSpec中的子图位置。
1 | subplot2grid |
一个辅助函数,类似于pyplot.subplot,但是使用基于 0
的索引,并可使子图跨越多个格子。
subplot2grid基本示例
要使用subplot2grid,你需要提供网格的几何形状和网格中子图的位置。 对于简单的单网格子图:
1 | ax = plt.subplot2grid((2,2),(0, 0)) |
等价于:
1 | ax = plt.subplot(2,2,1) |
要注意不像subplot,gridspec中的下标从 0
开始。
为了创建跨越多个格子的子图,
1 | ax2 = plt.subplot2grid((3,3), (1, 0), colspan=2) |
例如,下列命令:
1 | ax1 = plt.subplot2grid((3,3), (0,0), colspan=3) |
会创建:

GridSpec和SubplotSpec
你可以显式创建GridSpec并用它们创建子图。
例如,
1 | ax = plt.subplot2grid((2,2),(0, 0)) |
等价于:
1 | import matplotlib.gridspec as gridspec |
gridspec示例提供类似数组(一维或二维)的索引,并返回SubplotSpec实例。例如,使用切片来返回跨越多个格子的SubplotSpec实例。
上面的例子会变成:
1 | gs = gridspec.GridSpec(3, 3) |

调整 GridSpec布局
在显式使用GridSpec的时候,你可以调整子图的布局参数,子图由gridspec创建。
1 | gs1 = gridspec.GridSpec(3, 3) |
这类似于subplots_adjust,但是他只影响从给定GridSpec创建的子图。
下面的代码
1 | gs1 = gridspec.GridSpec(3, 3) |
会产生

使用 SubplotSpec创建 GridSpec
你可以从SubplotSpec创建GridSpec,其中它的布局参数设置为给定SubplotSpec的位置的布局参数。
1 | gs0 = gridspec.GridSpec(1, 2) |

使用SubplotSpec创建复杂嵌套的GridSpec
这里有一个更复杂的嵌套gridspec的示例,我们通过在每个 3x3
内部网格中隐藏适当的脊线,在 4x4
外部网格的每个单元格周围放置一个框。

网格尺寸可变的GridSpec
通常,GridSpec创建大小相等的网格。你可以调整行和列的相对高度和宽度,要注意绝对高度值是无意义的,有意义的只是它们的相对比值。
1 | gs = gridspec.GridSpec(2, 2, |

seaborn
seaborn是对matplotlib进一步的封装,简单点来说就是更简单了。
官网https://seaborn.pydata.org/
我这里放几个我感觉用得上的代码。
lineplot
seaborn.lineplot(x=None, y=None, hue=None, size=None, style=None, data=None, palette=None, hue_order=None, hue_norm=None, sizes=None, size_order=None, size_norm=None, dashes=True, markers=None, style_order=None, units=None, estimator=‘mean’, ci=95, n_boot=1000, seed=None, sort=True, err_style=‘band’, err_kws=None, legend=‘brief’, ax=None, **kwargs)
https://seaborn.pydata.org/generated/seaborn.lineplot.html
heatmap
seaborn.heatmap(data, vmin=None, vmax=None, cmap=None, center=None, robust=False, annot=None, fmt=‘.2g’, annot_kws=None, linewidths=0, linecolor=‘white’, cbar=True, cbar_kws=None, cbar_ax=None, square=False, xticklabels=‘auto’, yticklabels=‘auto’, mask=None, ax=None, **kwargs)
https://zhuanlan.zhihu.com/p/35494575
implot
eaborn.lmplot(x, y, data, hue=None, col=None, row=None, palette=None, col_wrap=None, size=5, aspect=1, markers=‘o’, sharex=True, sharey=True, hue_order=None, col_order=None, row_order=None, legend=True, legend_out=True, x_estimator=None, x_bins=None, x_ci=‘ci’, scatter=True, fit_reg=True, ci=95, n_boot=1000, units=None, order=1, logistic=False, lowess=False, robust=False, logx=False, x_partial=None, y_partial=None, truncate=False, x_jitter=None, y_jitter=None, scatter_kws=None, line_kws=None)
https://zhuanlan.zhihu.com/p/25909753
常见统计图片基本都可以在这里面看到
https://seaborn.pydata.org/examples/index.html
subplot_adjust
1 | matplotlib.pyplot.subplots_adjust(*args, **kwargs) |
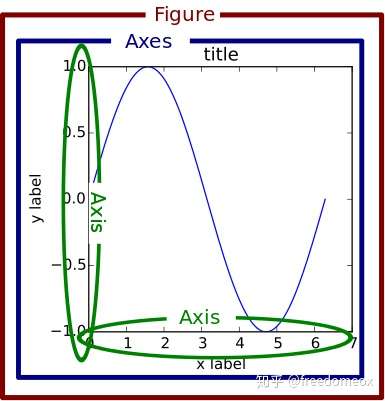
plt/ax/fig

尽量避免直接使用plt
https://zhuanlan.zhihu.com/p/93423829