Annotated Bibliography 2021 1.8-1.15
Book Reading Ch. 3.9-3.10 of book <Emery, William, and Adriano Camps. Introduction to satellite remote sensing: atmosphere, ocean, land and cryosphere applications. Elsevier, 2017.>
Effects of forward models on the semi-analytical retrieval of inherent optical properties from remote sensing reflectance
Book Reading
3.9 LIGHT DETECTION AND RANGING
Light detection and ranging (LIDAR) is sometimes called “laser radar” in an abuse of language because its principles are similar to those of the radar systems that will be discussed later in this text.
LIDAR is an optical remote sensing technique that measures the properties of scattered light to find the range or speed of distant targets, or the backscattering and attenuation of volume targets such as the atmosphere or the sea water.
As in radar systems, the range to an object is determined by measuring the time delay between transmission of a (light) pulse and the detection of the reflected signal. LIDAR technology was first used in 1962 by Fiocco and Smultin reflecting a laser beam off the surface of the Moon and studying the turbidity in upper atmospheric layers.
Later, in 1963 it was used by Ligda to perform the first cloud height and aerosols measurements.
LIDAR has seen applications in archeology, geography, geology, geomorphology, seismology, remote sensing, and atmospheric physics.
3.9.1 Physics of the measurement
The main difference between LIDAR and radar is that LIDAR operates with much shorter wavelengths of the EM spectrum, in atmospheric transmission windows in the ultraviolet (UV), visible, and near-IR (e.g., 0.4-0.7, 0.7-1.5, 3-5, and 9-13 mm) (http://en.wikipedia.org/wiki/lidar).
Thus, in general it is possible to detect a feature or object, which is about the size of the wavelength or larger.
Thus, LIDAR is very sensitive to atmospheric aerosols and cloud particles and has many applications in atmosphere research and meteorology.
However, an object needs to produce a dielectric discontinuity to reflect the transmitted wave.
At radar (microwave or radio) frequencies, a metallic object produces a significant reflection. However nonmetallic objects, such as rain and rocks produce weaker reflections and some materials may produce nondetectable reflection at all, meaning some objects or features are effectively invisible at radar frequencies. This is especially true for very small objects (such as single molecules and aerosols).
Lasers provide one solution to these problems. The beam densities and coherency are excellent, and the wavelengths are much smaller. The basic atmospheric LIDAR equation (volumetric target) is given by $$ P(\lambda,R)=P_0*\frac{c\tau}{2}*\beta(\lambda,R)*\frac{A_r}{R^2}*exp(-2\int_0^R\alpha(\lambda,R)dr)*\xi(\lambda)*\xi(R) $$
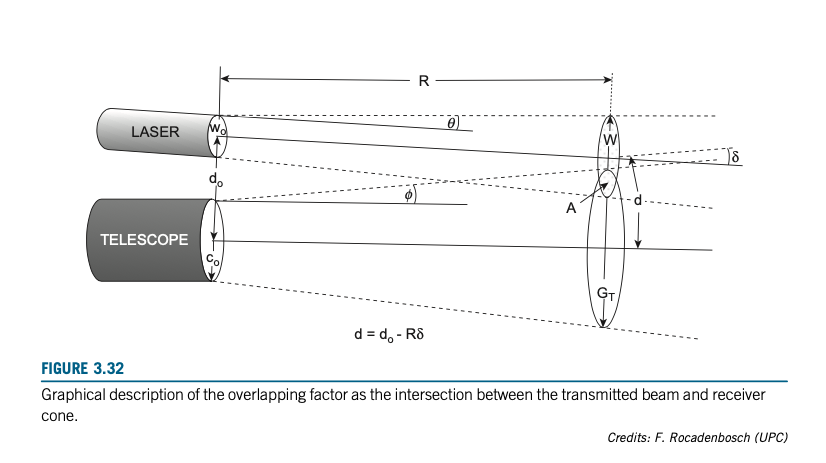
P(λ,R) is the received power at a wavelength λ from a range R, which is associated with a time delay t = 2 * R/c,P0 is the transmitted pulse power, τ is the pulse duration, c * τ/2 is the pulse “duration” is the range direction, β(λ,R) is the backscattering coefficient, Aτ is the effective area of the receiving system(typically a telecope), α(λ,R) is the absorption coefficient of the atmosphere, ξ(λ) is the transmissivity of the receiver optics, and ξ(R) is the so-called overlapping factor, which accounts for the volume intersection between the transmitted lase beam and the receiving cone, as illustrated in thies figure 3.32
The detected output voltage of the LIDAR returns at each range gate is proportional to the received power

Where GT is the amplifier’s voltage gain, Pback is the background power (power collected from the amibient light), S stands for the siganl term, Voff stands for the offset term(to be compensated for), and all other terms have been previously defined.
The noise associated to the LIDAR measurements has three different contributions: the “shot” noise associated with the signal power (P), the “shot” noise associated to the background power, and the thermal noise(σthermal2)

Since the SNR is typically very low, long incoherent averaging is required to increase it as in radar systems.
Different types of scattering are used for different LIDAR applications, most common are Rayleigh scattering, Mie scattering, and Raman scattering as well as fluorescence. The wavelengths are ideal for making measurements of smoke and other airborne particles (aerosols), clouds, and air molecules. A laser typically has a very narrow beam, which allows the mapping of physical features with very high resolution compared with radar. In addition, many chemical compounds interact more strongly at visible wavelengths than at microwaves, resulting in a stronger image of these materials. Suitable combinations of lasers can allow for remote mapping of atmospheric contents by looking for wavelength-dependent changes in the intensity of the returned signal.
LIDAR has been used extensively for atmospheric research and meteorology. With the deployment of the global positioning systems (GPS) in the 1980s precision positioning of aircraft became possible.
GPS-based surveying technology has made airborne surveying and mapping applications possible and practical. Many have been developed, using downward-looking LIDAR instruments mounted in aircraft or satellites.
3.9.2 OPTICAL AND TECHNOLOGICAL CONSIDERATIONS
There are in general two kinds of LIDARs: “incoherent” or direct detection of the power return, mainly an amplitude measurement, and “coherent” which uses the Doppler shift and must keep track of the phase information in each laser pulse. Coherent systems generally use optical heterodyne detection which is more sensitive than direct detection and allows operation at a much lower power levels, but at the expense of having more complex transceiver requirements.
In both coherent and incoherent LIDARs, there are two types of pulse models: micropulse and high-energy LIDARs. Micropulse systems have been developed as a result of the ever-increasing computer power available to process the sensor data combined with marked advances in laser tech- nology. Micropulse systems typically operate at power levels that are “eye safe” meaning that they can operate without any additional safety precautions. High-power systems are common in atmospheric research where they are widely used for measuring atmospheric parameters such as cloud height, layering and densities of clouds, cloud particle properties, temperature, pressure, wind, humidity, trace gas concentrations (ozone, methane, nitrous oxide, etc.), aerosols.
The components of a typical LIDAR are as follows:
Laser. 600e1000 nm lasers are most common for nonscientific applications. They are inexpensive, but since they can be focused and easily absorbed by the eye the maximum power is limited by the need to make them eye-safe. Eye safety is often a requirement for most applications. A common alternative, the 1550 nm lasers are eye-safe at much higher power levels since this wavelength is not focused by the eye, but the detector technology is less advanced in this spectral region, so these wavelengths are generally used at longer ranges and lower accuracies. Airborne topographic mapping LIDARs generally use 1064 nm diodeepumped YAG lasers, while bathymetric systems generally use 532 nm frequency doubled diodeepumped YAG lasers because 532 nm penetrates water with much less attenuation than does 1064 nm. Variables in the individual systems include the ability to set the number of passes required through the gain (YAG, YLF, etc.) and Q-switch speed. Shorter pulses achieve better target resolution provided the LIDAR receiver detectors and electronics have sufficient bandwidth.
Scanner and optics. How fast images can be developed is also affected by the speed at which they can be scanned into the system. There are several different ways to scan the azimuth and elevation, including dual oscillating plane mirrors, a combination with a polygon mirror, a dual axes scanner. Optic choices affect the angular resolution and range that can be detected. A hole- mirror or beam splitter can be used to collect a laser return signal.
Photodetector and receiver electronics. Two different photodetector technologies are used in today’s LIDARs: solid-state photodetectors, such as silicon avalanche photodiodes, or photomultipliers. The sensitivity of the receiver is another parameter that has to be balanced in a LIDAR design.
Position and navigation systems. LIDAR sensors mounted on mobile platforms such as airplanes or satellites require instrumentation to determine the absolute position and orientation (pointing angle) of the sensor. GPS and inertial measurement unit systems are primary types of systems used for this purpose.
3.9.3 APPLICATION OF LIDAR SYSTEMS
There are many different applications of LIDAR systems, but we will concentrate on those primarily in meteorology, which was one of the earliest applications of LIDAR remote sensing. The first LIDARs were used for studies of atmospheric composition, structure, clouds, and aerosols. Initially based on rube lasers, LIDARs for meteorology were constructed shortly after the invention of the laser.
Some modern LIDARs are as follows:
Elastic backscatter LIDAR is the simplest form of LIDAR and is typically used for studies of aerosols and clouds. The backscattered wavelength is identical to the transmitted wavelength, and the magnitude of the received signal at a given range depends on the backscatter coefficient of scatterers at that range and the extinction coefficients of the scatterers along the path to that range. The extinction coefficient is typically the quantity of interest.
Differential absorption LIDAR (DIAL) is used for range-resolved measurements of a particular gas in the atmosphere, such as ozone, carbon dioxide, or water vapor. The LIDAR transmits two wavelengths: an “on-line” wavelength that is absorbed by the gas of interest and an off-line wavelength that is not absorbed. The differential absorption between the two wavelengths is a measure of the concentration of the gas as a function of range. DIAL LIDARs are essentially dual-wavelength elastic backscatter LIDARs.
Raman LIDAR is also used for measuring the concentrations of atmospheric gases, but can also be used to retrieve aerosol parameters as well. Raman LIDAR exploits inelastic scattering to single out the gas of interest from all other atmospheric constituents. A small portion of the energy of the transmitted light is deposited in the gas during the scattering process, which shifts the scattered light to a longer wavelength by an amount that is unique to the species of interest. The higher the concentration of the gas, the stronger the magnitude of the backscattered signal.
Doppler LIDAR is used to measure wind speed along the beam by measuring the frequency shift of the backscattered signal. Scanning LIDARs have been used to measure atmospheric wind velocity in a large three-dimensional core. ESA’s wind mission Atmospheric Dynamics Mission Aeolus (ADM-Aeolus) will be equipped with a Doppler LIDAR system to provide global measurements of vertical wind profiles. Doppler LIDAR systems are now beginning to be successfully applied in the renewable energy sector to acquire wind speed, turbulence, wind veer, and wind shear data. Both pulse and continuous wave systems are being used for these applications.
The number of spaceborne LIDARs has been very limited because of the reliability of lasers. So far,
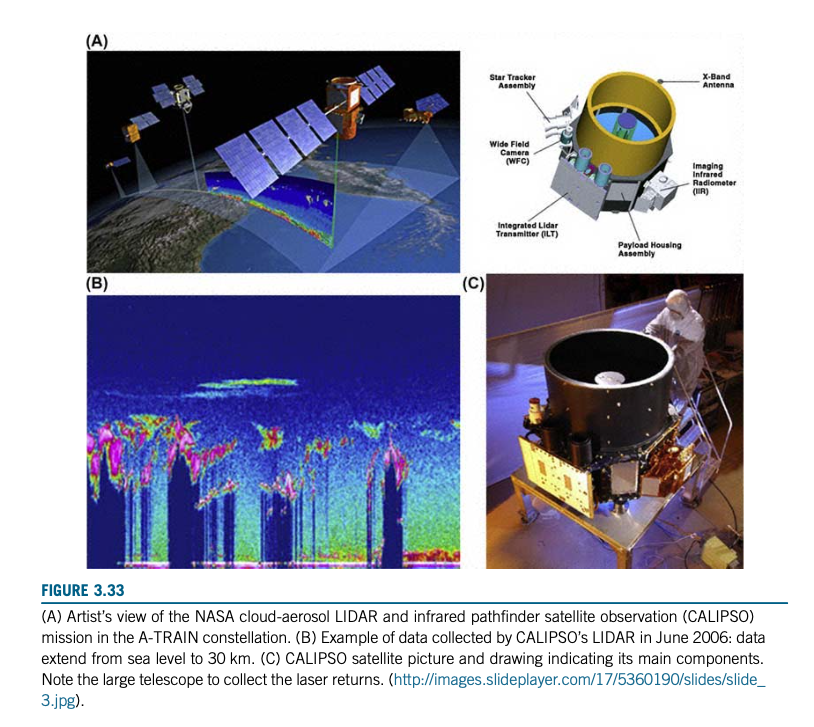
the only LIDAR-based mission is the NASA/CNES cloud-aerosol LIDAR and infrared pathfinder satellite observation (CALIPSO) mission, which belongs to the A-TRAIN constellation. CALIPSO combines an active LIDAR instrument with passive IR and visible imagers to probe the vertical structure and properties of thin clouds and aerosols over the globe.
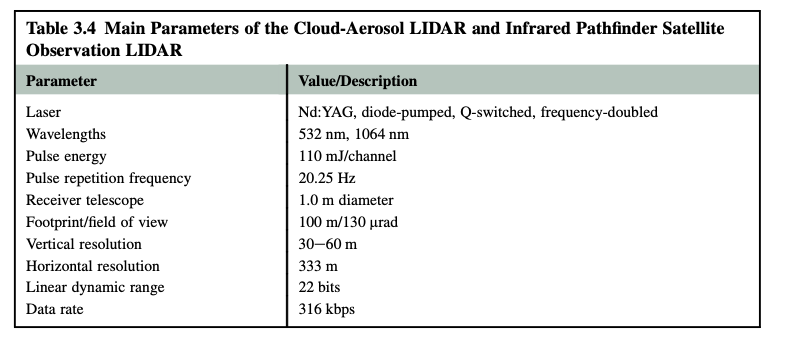
CALIPSO was launched on April 28, 2006, with the cloud profiling radar system on the CloudSat satellite. Fig. 3.33 shows an artist’s view of the CALIPSO mission in the A-TRAIN constellation, a picture and a drawing of it, and sample LIDAR returns from the sea surface up to 30 km height. The dark blue regions underneath the high- reflectivity regions (in pink) correspond to regions where the SNR is too low because of the increased attenuation of the signal in previous regions. The main engineering parameters of the CALIPSO LIDAR are listed in Table 3.4.
WIND LIDAR
As just mentioned a wind LIDAR is a Doppler LIDAR that uses the frequency shift of the back- scattered signal to determine the wind velocity. This concept is depicted here in Fig. 3.34 adapted from Dobler et al., 2002.
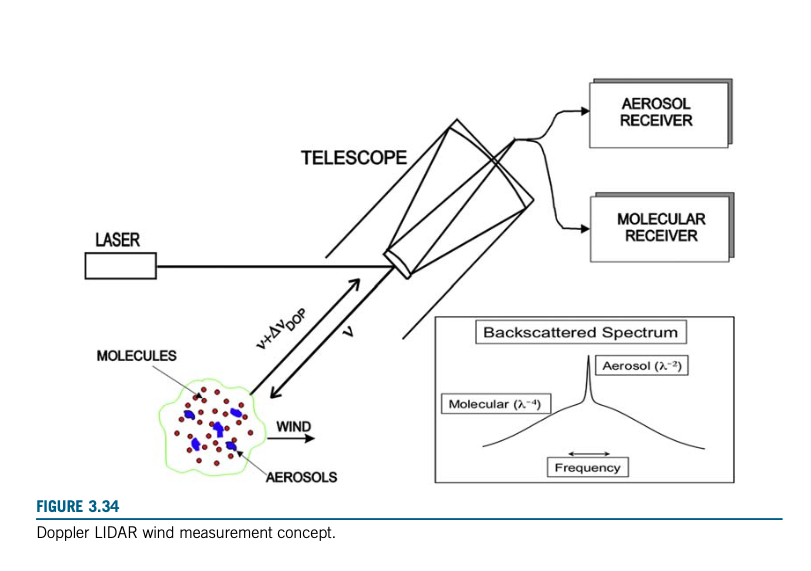
This coherent Doppler wind LIDAR measures the frequency of the beat signal obtained by optically mixing the return signal with the local oscillator. As a consequence, both the local oscillator and the return signal must have narrow bandwidths to have sufficient coherent lengths. Thus, coherent LIDAR detection relies of the aerosol scattering with very narrow Doppler broadening meaning the LIDAR wind measurements apply only to those atmospheric regions with adequate aerosol loading.
Since the Mie scattering due to aerosols is better suited to frequency analysis than is the molecular Rayleigh scattering the choice of LIDAR wavelength depends on the expected return signal and the expected ratio of aerosol-to-molecular backscatter. The molecular scattering cross-section is proportional to λ−4, and the aerosol signal is proportional to between λ−2 and λ+1, depending on the wavelength and particle size and shape.
Even if the aerosol returns decrease with increasing wavelength, the molecular background de- creases much faster, so that the aerosol-to-molecular backscatter ratio becomes more favorable to the measurement. Therefore, longer wavelengths are desirable to minimize the influence of molecular (Rayleigh) scattering. Coherent Doppler LIDARs use laser wavelengths between 1 and 11 mm.
Vector Wind Velocity Determination
Vector wind measurements require radial velocity measurements from three independent “lines-of- sight” meaning you must have three LIDARs. If it can be assumed that there is no vertical velocity (W 1⁄4 0), then only two LIDARs are needed. If horizontal homogeneity of the wind field can be assumed, then a LIDAR beam scanning technique can be used to determine the wind velocity.
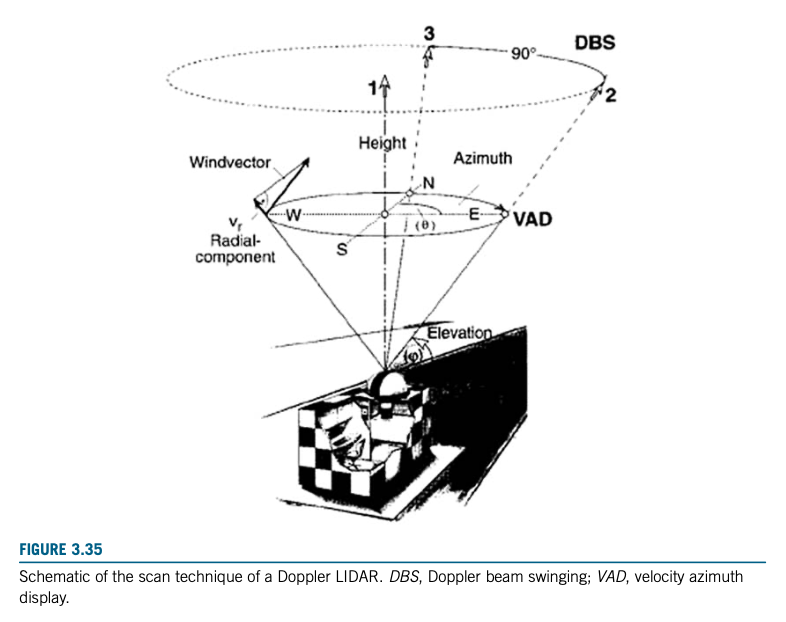
The two main techniques are the velocity azimuth display (VAD) which is a conical scan LIDAR beam at a fixed elevation angle, and the Doppler beam swinging (DBS) which is a LIDAR pointing in the vertical which is tilted east and tilted north. These two methods are graphically displayed in Fig. 3.35.
Velocity Azimuth Display LIDAR Vector Wind Method
The VAD scheme is a conical scan LIDAR beam at a fixed elevation angle (Fig. 3.35). For a ground-based LIDAR, positive u, b, w are are defined as the wind blowing toward the East, North, and upward, and the positive radial wind V⃗R as the wind blowing away from the LIDAR. V⃗R consists of the following u, v, w components:

θ is the azimuth angle clockwise from the north, and φ is the elevation angle.
For each VAD scan the elevation angle φ is fixed and known, the azimuth angle θ is varied, but is also known. V⃗R is measured so the three unknowns u, v and w can be derived directly from fitting the data with the above Eq. (3.15).
Doppler Beam Swinging LIDAR Vector Wind Method
The DBS technique consists of pointing a LIDAR in the vertical up, and then tilting it east and north
If γ is the off-zenith angle , then:
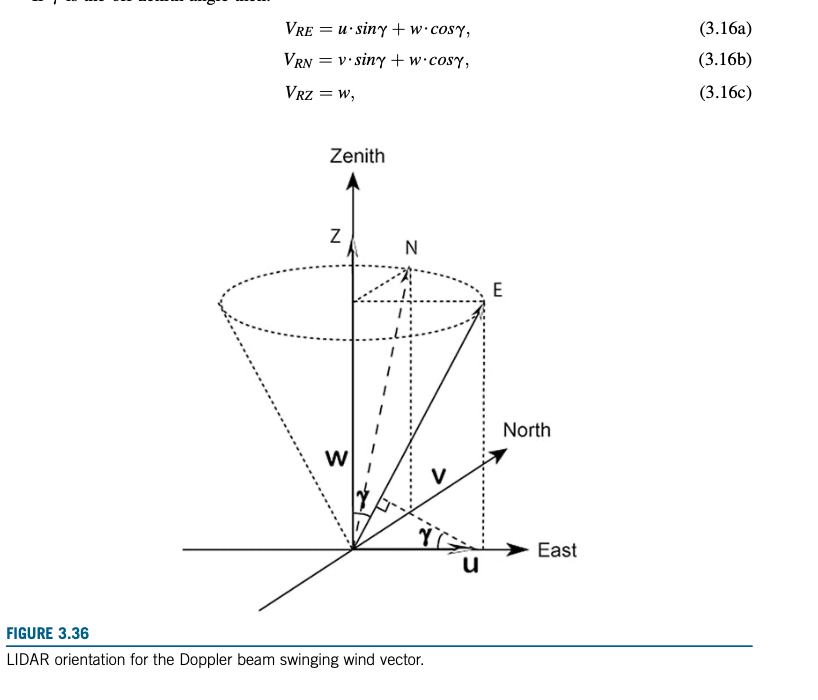
Then:

Where VRz, VRE, VRN are the vertical, tilted east, and tilted north radial velocities, respectively.
Direct Detection Doppler Wind LIDAR
Direct Detection Doppler (DDL) uses incoherent detection to measure the spectrum of returned sig-nals. DDL can use aerosol/molecular scattering and/or resonance fluorescence to measure the wind from the ground to the upper atmosphere. There are several different ways to do the spectral analysis for the DDL method:
- Resonance fluorescence Doppler LIDAR uses the atmospheric atomic or molecular absorption lines as the frequency analyzer/discriminator.
- Direct detection Doppler LIDAR is based on molecular absorption edge filter, e.g., iodine (I2) vapor filter, Na or K magnetooptic filter.
- Direct detection Doppler LIDAR is based on optical interferometer edge-filter, e.g., FabryePerot etalon transmission edge.
- Direct detection Doppler LIDAR is based on fringe patter imaging of an optical interferometer, e.g., FPI imaging.
LIDAR Wind Summary
Doppler wind techniques measure the wind velocity along the LIDAR beam requiring three independent radial velocity measurements from three independent lines of sight.
Rather than point three different LIDARs in three different directions, we assume horizontal homogeneity of the wind field over the volume we are sensing and employ scanning LIDAR techniques to determine the vector wind.
The two main scanning techniques are the VAD and the DBS methods. There are different wavelength requirements for coherent and incoherent detection LIDARs.
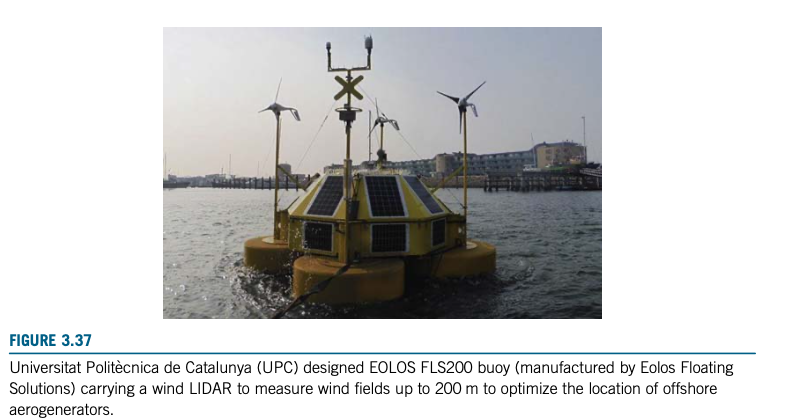
Fig. 3.37 shows a commercial buoy carrying a VAD wind LIDAR (principles of operation explained below) to measure wind profiles up to 200 m height to optimize the selection of offshore aerogenerators
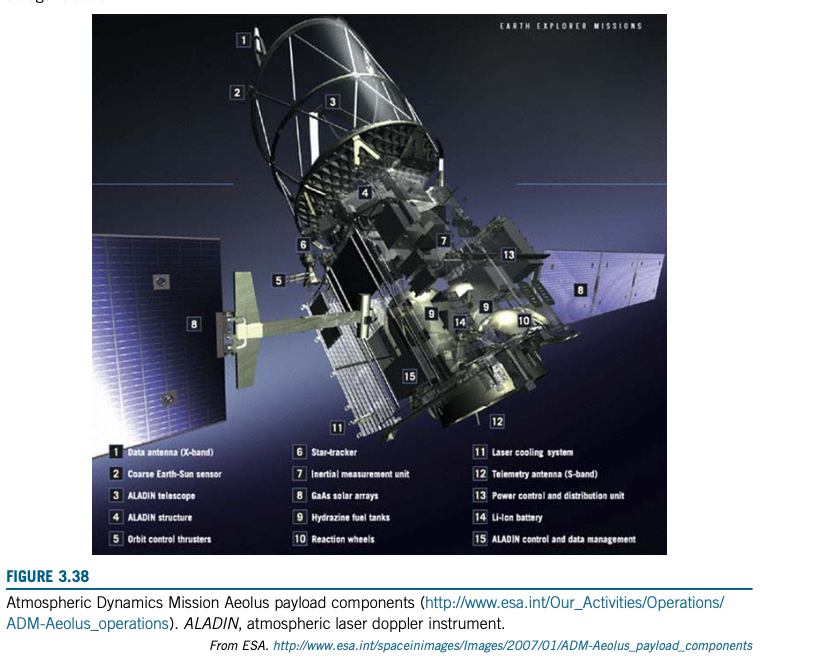
An example of a spaceborne wind LIDAR is the upcoming ESA ADM-Aeolus that will be launched in 2017 and will provide for the first time global observation of wind profiles from space to further our knowledge of Earth’s atmosphere and weather systems. Aeolus carries a single payload, the atmospheric laser Doppler instrument (ALADIN), a direct detection Doppler wind LIDAR operating at near UV wavelengths (355 nm).
It comprises two main assemblies: (1) Transmitter: diode lasere pumped Nd:YAG laser, frequency tripled to 355 nm at 150 mJ pulse energy, 100 Hz pulse repetition and (2) Receiver: 1.5 m diameter SiC telescope, Mie channel (aerosol and water droplets) with Fizeau spectrometer, Rayleigh channel (molecular scattering). Fig. 3.38 shows an artist’s view of the satellite ADM-Aeolus and its different subsystems.
Effects of forward models on the semi-analytical retrieval of inherent optical properties from remote sensing reflectance
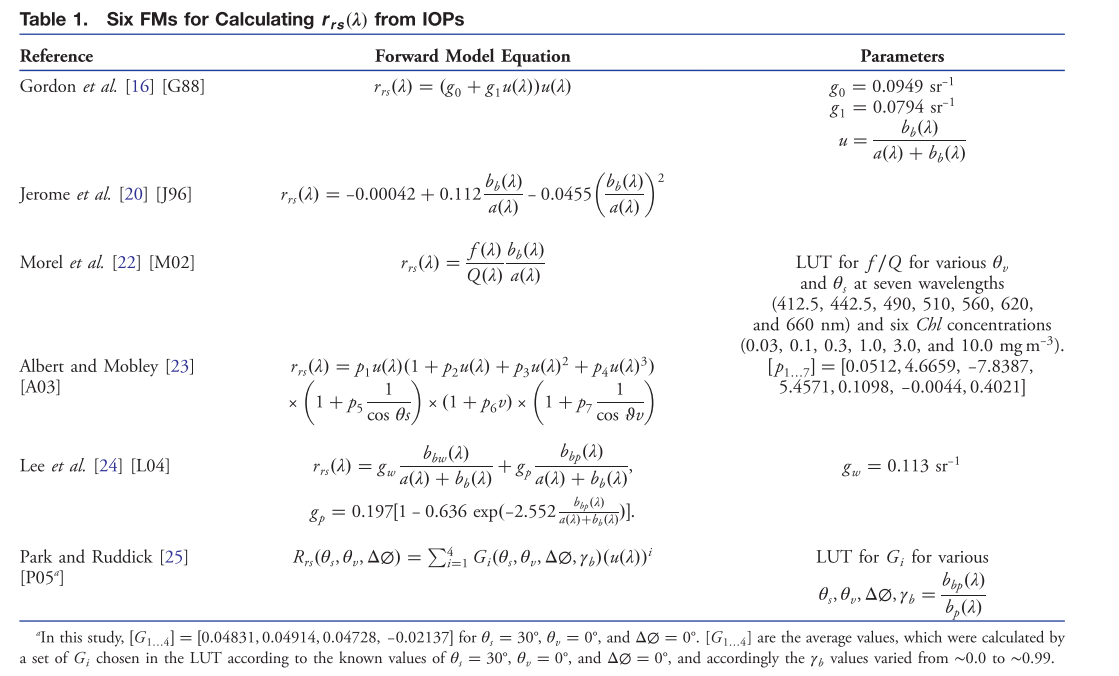
Six FMs
Result for Rrs
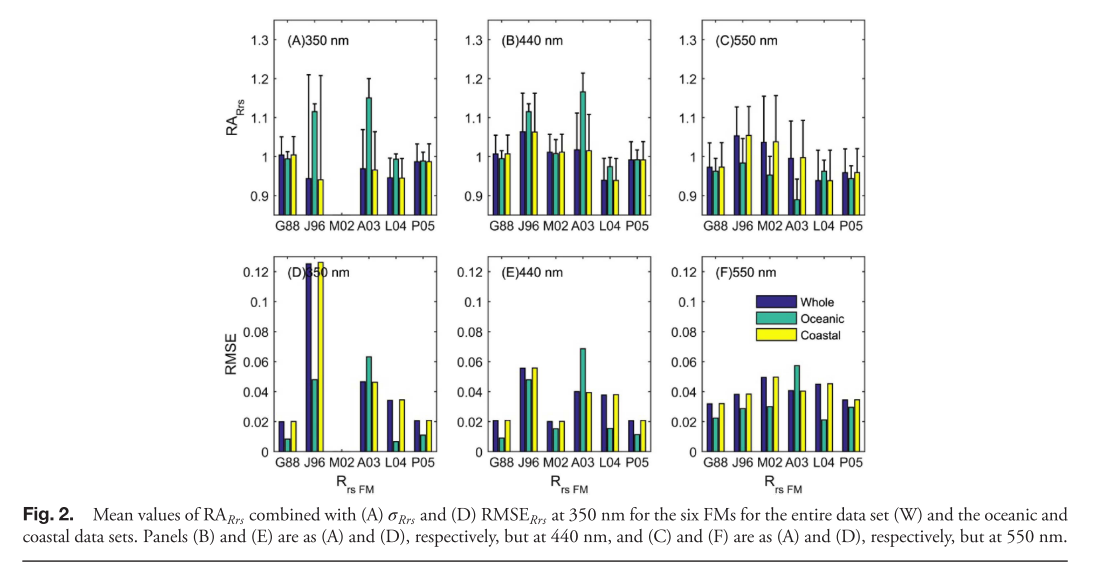
I think in the coastal area, G88 works best, briefly.
Result for inversion
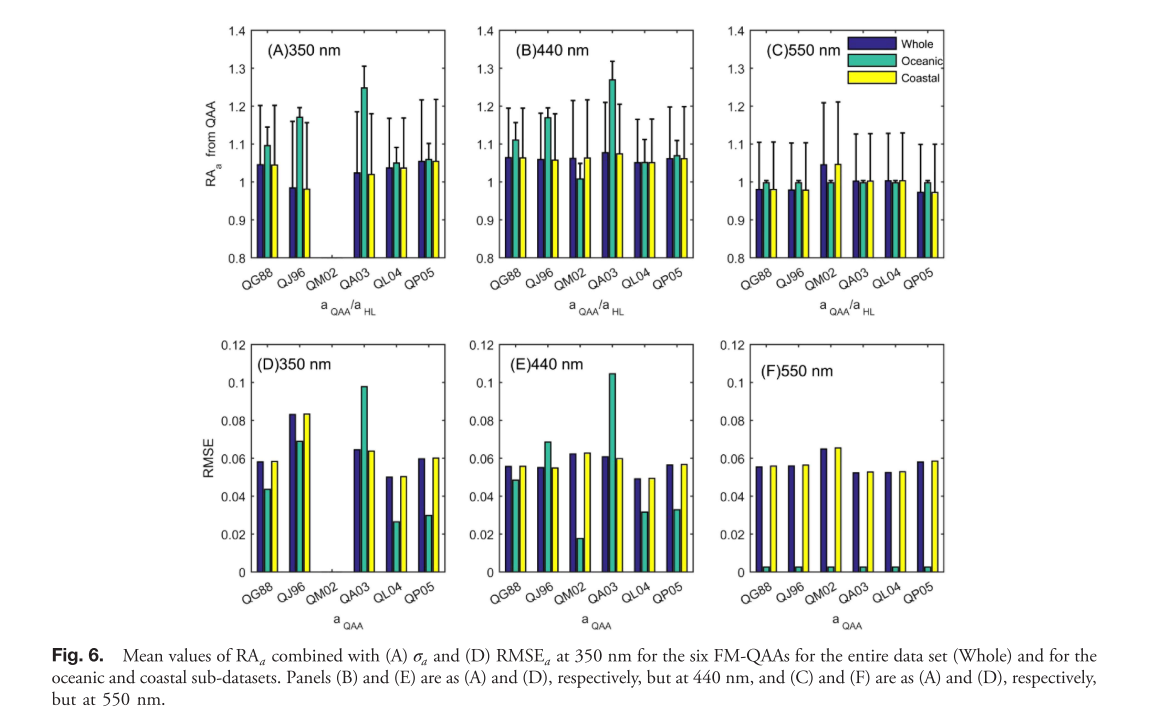
This is just total absorption, I think.
For descriptive purposes, the results from QAA with the six FMs are denoted as QG88, QJ96, QM02, QA03, QL04, and QP05, and their retrievals are termed aQAA_FM and bb_QAA_FM, respectively.
Fucking these abbreviations.
L04 works best. J96 P05 G88 are similar.
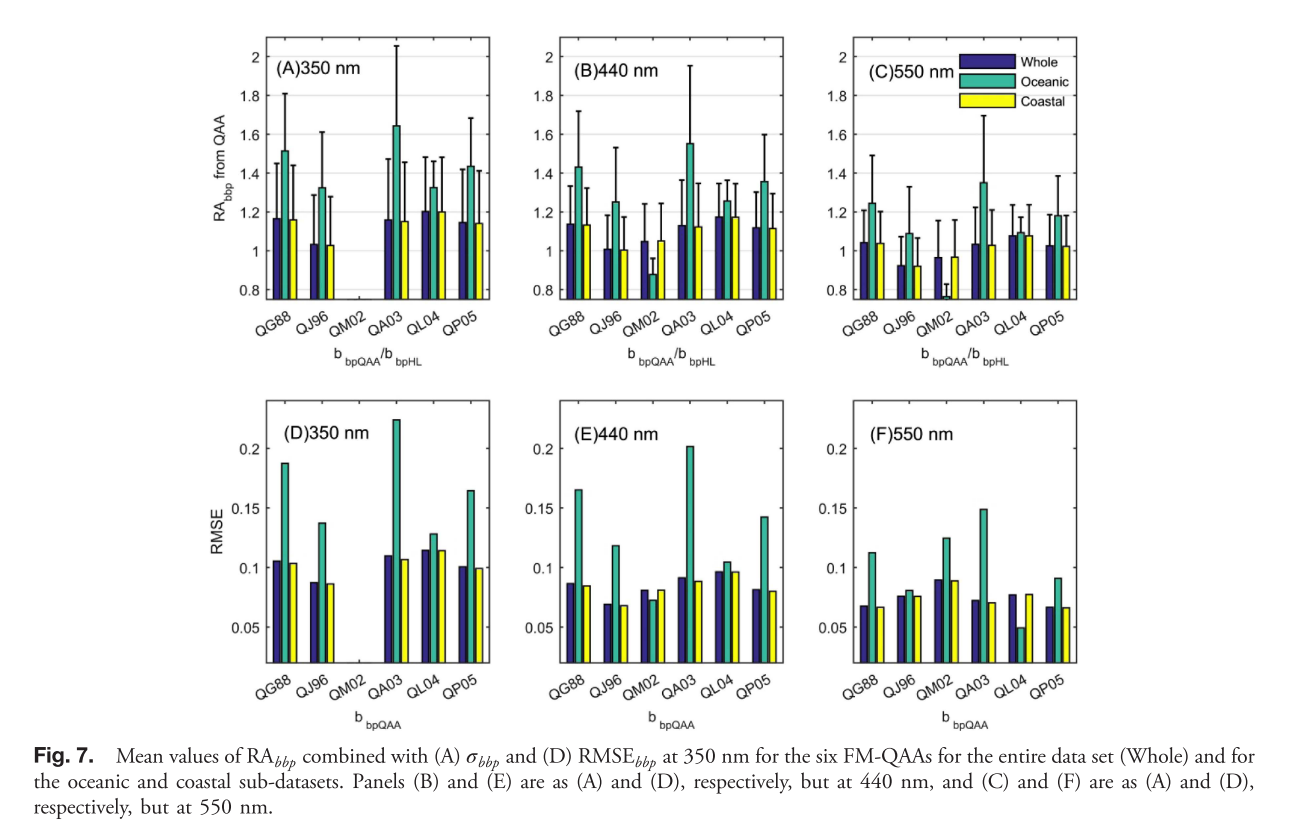
For bbp, J96 works best. L04 worst.
终于懂了那个看论文只需要看图到底是啥意思。
The results showed that different FMs can have quite different effects on the computed Rrs?λ?, and, in particular, the effects are not necessarily uni- form. For this synthetic data set and for the six FMs evalu- ated, G88 and P05 provided the best estimates of Rrs?λ? for the given IOPs at 350, 440, and 550 nm. Additionally, G88 and P05 performed similarly in both the oceanic and coastal conditions, and were relatively weakly influenced by the change in particle PF. M02 also provided good estimation but only at 440 nm, and L04 performed well only in the oceanic condition.
In the coastal sub-dataset, QAA and GIOP combined with G88 or P05 provided slightly better quality IOPs compared with the other four FMs. Compared with GIOP in the coastal condition, QAA in the coastal con- dition combined with G88 or P05 always performed better at retrieving a?λ? but was weaker at retrieving bbp?λ?. It must be noted that only effective retrievals from each FM-GIOP were considered for comparison; about 18%–25% of retrievals from GIOP were filtered out in advance due to bad performance.
Water Classification Combined Inversion/Retrieval
A hybrid algorithm for estimating the chlorophyll-a concentration across different trophic states in Asian inland waters
Optical water type discrimination and tuning remote sensing band-ratio algorithms: application to retrieval of chlorophyll and kd (490) in the Irish and Celtic seas
Influence of a red band-based water classification approach on chlorophyll algorithms for optically complex estuaries
A soft-classification-based chlorophyll-a estimation method using MERIS data in the highly turbid and eutrophic Taihu Lake
A system to measure the data quality of spectral remote-sensing reflectance of aquatic environments