matplotlib-subplot

今天发现的一些东西

子图间距调整

来自 https://blog.csdn.net/qq_33039859/article/details/79424858

1
2
3
4
5
6
7
8
9
10
plt.subplots_adjust(left=None, bottom=None, right=None, top=None,
wspace=None, hspace=None)12
left = 0.125 # the left side of the subplots of the figure
right = 0.9 # the right side of the subplots of the figure
bottom = 0.1 # the bottom of the subplots of the figure
top = 0.9 # the top of the subplots of the figure
wspace = 0.2 # the amount of width reserved for blank space between subplots,
# expressed as a fraction of the average axis width
hspace = 0.2 # the amount of height reserved for white space between subplots,
# expressed as a fraction of the average axis height

共享坐标轴

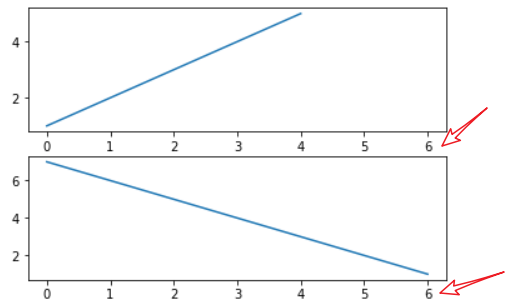
当你通过pyplot.subplot()pyplot.axes()函数或者Figure.add_subplot()Figure.add_axes()方法创建一个Axes时,你可以通过sharex关键字参数传入另一个Axes表示共享X轴;或者通过sharey关键字参数传入另一个Axes表示共享Y轴。共享轴线时,当你缩放某个Axes时,另一个Axes也跟着缩放。

1
2
3
4
5
fig =plt.figure()
ax1 =fig.add_subplot(211)
ax1.plot([1,2,3,4,5])
ax2 =fig.add_subplot(212,sharex=ax1)
ax2.plot([7,6,5,4,3,2,1])
1252882-20191225232904746-1316411337